
Host browse list
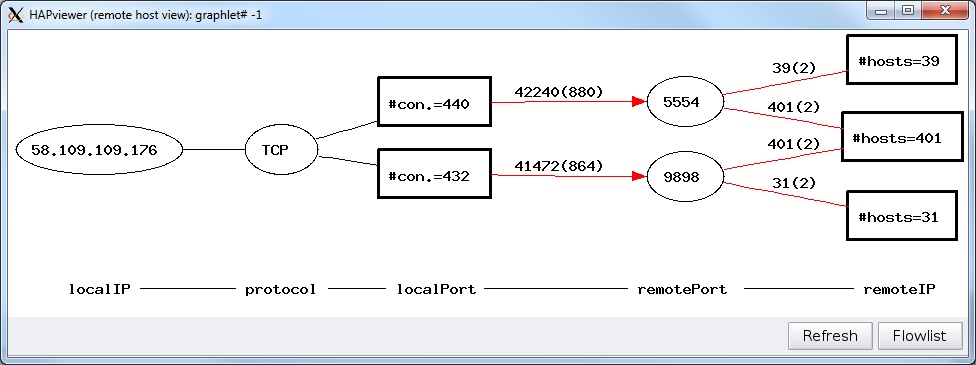
Example of a host acting as a scanner
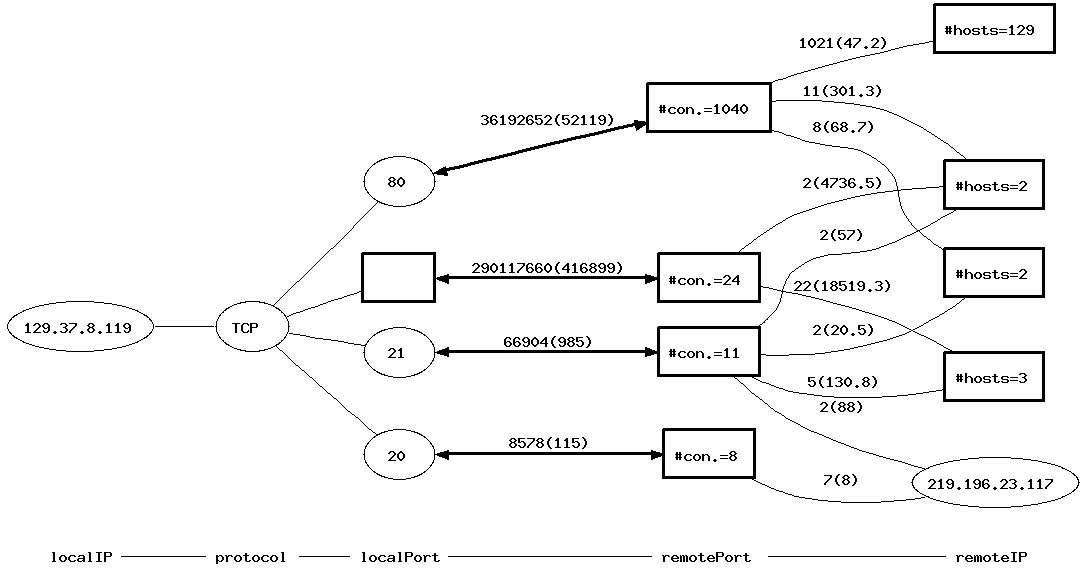

Example of a Web- and FTP-server having 137 clients
Example of a flow list
HAPviewer is a host application profile graphlet viewer.
It visualizes network data through graphs on a per-host level in such a way that running applications are apparent.
Moreover, it summarizes groups of flows in an intelligent way providing aggregates of per-role traffic.
Supported roles are: client, server, multi-clients and variations of peer-to-peer.
HAPviewer allows you to:
Obtain a quick overview of a host's network activity showing which applications are run.
Summarize flows on a per-service level resulting in compact graphs that visualize hundreds or even thousands of flows in an intuitive way.
Identify interesting hosts through a host browser for an in-depth inspection.
Suggested applications are:
Analyzing security incidents.
Inspecting traffic of your own PC to unhide suspicious activities.
Instructing the Berkely Socket Model.
Research in traffic analyis.
HAPviewer is available as a stand-alone application with a graphical user interface, or as a shared library suitable for integration into
a more powerful monitoring software.
Currently, a project is running with the goal to integrate HAPviewer into the NfSen monitoring software.
HAPviewer is available at sourceforge and distributed under the Gnu Public License version 2 or the modified BSD license.
|
|
|
|
Host browse list |
Example of a host acting as a scanner |
|
|
|
|
Example of a Web- and FTP-server having 137 clients |
Example of a flow list |
The stand-alone version of HAPviewer is a C++ application using GTK+ for its graphical user interface.
HAPviewer can be built from source for Linux 32 and 64 bit systems. Basically, it should work for any Unix platform but has not been tested for.
HAPviewer makes use of the following packages - if not yet installed on your system then please do so before installing HAPviewer:
HAPviewer installation procedure:
This program has been successfully built and run under Xubuntu and Ubuntu 8.0.4 32 bit and Debian Hardy 64 bit.
A first version of HAPviewer has been presented at FloCon2010. A refined version will be presented at VizSec 2010 on 14. Sept. and is described in more detail in a paper available from the ACM Digital Library soon. Some information on the theory of working are provided in the section "Working with HAPviewer" below.
Network data can be loaded from files using the following formats:
Furthermore, HAPviewer can load and visualize graph descriptions in the dot language (employed by GraphViz) and simple gif graphics files. This feature is especially useful to visualize previously saved graphlets.
For archiving and reporting purposes HAPviewer supports the export of graphlets to gif and GraphViz dot files. To build collections from the data of most interesting hosts an export to cflow binary data files is supported. These binary files use the native flow format of HAPviewer and are gz-compressend for best disk space efficiency. If host data is saved to an existing file then it is appended to existing data resulting in a file that contains traffic data of multiple hosts.
In this section we illustrate the use of HAPviewer by describing the basic commands used most often. After start-up HAPviewer displays an empty application window having a menu bar at the top.

Main window

File chooser dialog
When traffic data is loaded a distinction is made between local and remote hosts. As traffic data can be collected at different points in a network this distinction needs additional information. This information has to be provided through a dialog asking the user for the local network address and the prefix length.

Network address and prefix dialog
In the example shown the IP address of an individual host is shown with a prefix length of 32 qualifying this IP address as the only local host.
When the file is loaded then a host browse list is displayed within the application area of the main window. In our example it comprises only one host.
In a general case it will show each local host on its own line (for a more complete example see next section).

Host browse list showing one host
The host browse list shows each local host on its own line together with some aggregate figures such as total count of flows, count of unidirectional flows, number of used protocols, total packet and byte counts. By clicking on the column titles the list can be sorted by the associated metric either in ascending or descending order. This helps in identifying interesting hosts, e.g. the heavy-hitters. The tool bar at the bottom of the main window provides navigation through the list, a display of the graphlet of a marked host and an optional flow list shown in a separate window.

Host browse list sorted by ascending flow counts
The example shows a list comprising over 736000 hosts, covering all hosts of a complete AS that experience traffic throughout a 10 minute interval.

Graphlet of a host assuming 3 different roles
The example above shows a host assuming server roles on local ports 80 and 53, and a potential client role on remote port 80. Showing all connections individually as in the example above, can produce overly large graphs containing too many details. To handle such situations a summarization is provided that groups toghether all flows of a particular role by replacing less important nodes by summary nodes. Applied to our example the port 80 server role is summarized reducing the graph size (see figure below). As can bee seen in the example we use rectangles for summary nodes to clearly differentiate them from regular nodes.

Graphlet of a host compressed by summarization
Similar summarization rules exist for client roles and variations of peer-to-peer roles. While summarization is switched on by default a configuration menu offers the user the choice which types of roles should be summarized (see screenshot below).

Summarization options menu
Additional settings can be made through a preferences dialog available under Configure->Preferences .

Preferences dialog
In case more details on the traffic of a host are needed the loaded flow list can be displayed through a separate window enabling the switching forth-and-back between aggregated form and full details as needed by many analysts. The flow list display contains flow start and duration information not visible in the graphlet. Comparable to the host browser the flow list can be sorted by each of its columns by clicking on the column title.
Example of a flow list
The HAPviewer stand-alone version offers a host browser to identify most interesting hosts. However, there are situations in which this is not sufficient or not flexible enough. In the presence of powerful freely available frameworks for network monitoring we provide a library version (libhapviz) of HAPviewer that can be integrated in these tools to enable them to visualize host traffic through HAP graphlets. This program library is implemented as a shared library and a header file exposing its interface. The interface is a C++ class that offers a function to read network data from an input file in any of the supported formats and creates a HAP graphlet saved as GraphViz dot file. The creation of the graphlet can be configured by a set of summarization and filter flags. To demonstrate the usage of the library an example application is provided that reads the name of an input file from the command line and then uses libhapviz to create a dot file from it. The dot file created can be used to visualize the graphlet in any of the graphics formats supported by the GraphViz library. Additionally, GraphViz offers the possibility to create a clickmap of the graphlet that can be used to make the graphlet image clickable.